内存泄露
前言
go中的内存泄露一般都是goroutine泄露,就是goroutine没有被关闭,或者没有添加超时控制,让goroutine一只处于阻塞状态,不能被GC。
场景
暂时性内存泄露
- 获取长字符串中的一段导致长字符串未释放
- 获取长slice中的一段导致长slice未释放
- 在长slice新建slice导致泄漏
string相比于切片少了一个容量的cap字段,可以把string当成一个只读的切片类型。获取长string或切片中的一段内容,由于新生成的对象和老的string或切片共用一个内存空间, 会导致老的string和切片资源暂时得不到释放,造成短暂的内存泄露。
永久性内存泄露
- goroutine泄漏
- time.Ticker未关闭导致泄漏
- Finalizer导致泄漏
- Deferring Function Call导致泄漏
具体的场景参考go101
下面主要就goroutine做个分析,这是最常见的内存泄露
goroutine内存泄露
首先明确一点
关闭不再需要使用的 channel 并不是必须的
跟其他资源比如打开的文件、socket 连接不一样,这类资源使用完后不关闭后会造成句柄泄露,channel 使用完后不关闭也没有关系,channel 没有被任何协程用到后最终会被 GC 回收。关闭 channel 一般是用来通知其他协程某个任务已经完成了。
也就是有goroutine引用的channel,是不会被gc,并且channel会使当前引用的goroutine一直阻塞,直到接收到退出的信号。
发送端channel满了
goroutine作为生产者向 channel发送信息,但是没有消费的goroutine,或者消费的goroutine被错误的关闭了。导致channel被打满。
func channelNoProducter() {
	ch := make(chan int)
	go func() {
		ch <- 1
		fmt.Println(111)
	}()
}
没有消费者,当channel满了,发送端的goroutine就会一直阻塞,直到channel被下游的消费者消费掉。
接收端消费的channel为空
作为消费者的goroutine,等待消费channel,但是上游的生产者不存在
func channelNoProducer() {
	ch := make(chan int, 1)
	go func() {
		<-ch
		fmt.Println(111)
	}()
}
goroutine等待消费channel,但是一直读取不到数据就会一直处于阻塞状态
生产者消费者异常退出,导致channel满了或者channel为空
作为生产者的goroutine如果没有数据发送了,就需要主动退出当前的goroutine,并且发出退出信号,这样下游消费的goroutine,才能在channel消费完的时候,优雅的退出,不至于阻塞在没有发送者的channel中。
作为消费者的goroutine一定要在channel没数据了,并且上游发送数据的goroutine已经退出的情况下,退出。这样,才不至于上游的发送者阻塞到一个没有消费者的channel中。
具体的发送关闭策略可参考channel的关闭
channel未初始化
func main() {
	var ch chan int

	go func(ch chan int) {
		<-ch
	}(ch)

	c := time.Tick(1 * time.Second)
	for range c {
		fmt.Printf("#goroutines: %d", runtime.NumGoroutine())
	}
}
channel未初始化,无论发送数据还是从里面接收数据,都会出现阻塞的情况
未添加超时处理
当然这不是goroutine泄露的原因,只是一个防止goroutine不能及时推出的处理策略
下面总结下超时处理的集中方案
使用context.WithTimeout
func TimeoutCancelContext() {
	ctx, cancel := context.WithTimeout(context.Background(), time.Duration(time.Millisecond*800))
	go func() {
		// 具体的业务逻辑
		// 取消超时
		defer cancel()
	}()

	select {
	case <-ctx.Done():
		fmt.Println("time out!!!")
		return
	}
}
1、通过context的WithTimeout设置一个有效时间为1000毫秒的context。
2、业务逻辑完成会调用cancel(),取消超时,如果在设定的超时时间内,业务阻塞没有完成,就会触发超时的退出。
使用channel
func TimeoutCancelChannel() {
	done := make(chan struct{}, 1)

	go func() {
		// 执行业务逻辑
		done <- struct{}{}
	}()

	select {
	case <-done:
		fmt.Println("call successfully!!!")
		return
	case <-time.After(time.Duration(800 * time.Millisecond)):
		fmt.Println("timeout!!!")
		// 使用独立的协程处理超时,需求添加return退出协程,否则会导致当前协程被通知channel阻塞,进而导致内存泄露
		return
	}
}
1、使用channel接收业务完成的通知
2、业务执行阻塞超过设定的超时时间,就会触发超时退出。
使用pprof排查
什么是pprof
pprof是Go的性能分析工具,在程序运行过程中,可以记录程序的运行信息,可以是CPU使用情况、内存使用情况、goroutine运行情况等,当需要性能调优或者定位Bug时候,这些记录的信息是相当重要。
基本使用
GO中已经封装好了,直接就能使用_ "net/http/pprof"
package main

import (
	"fmt"
	"net/http"
	_ "net/http/pprof"
)

func main() {
	// 开启pprof,监听请求
	ip := "127.0.0.1:6069"
	if err := http.ListenAndServe(ip, nil); err != nil {
		fmt.Printf("start pprof failed on %s\n", ip)
	}
}
浏览器查看
浏览器访问就能看到效果
http://127.0.0.1:6069/debug/pprof/
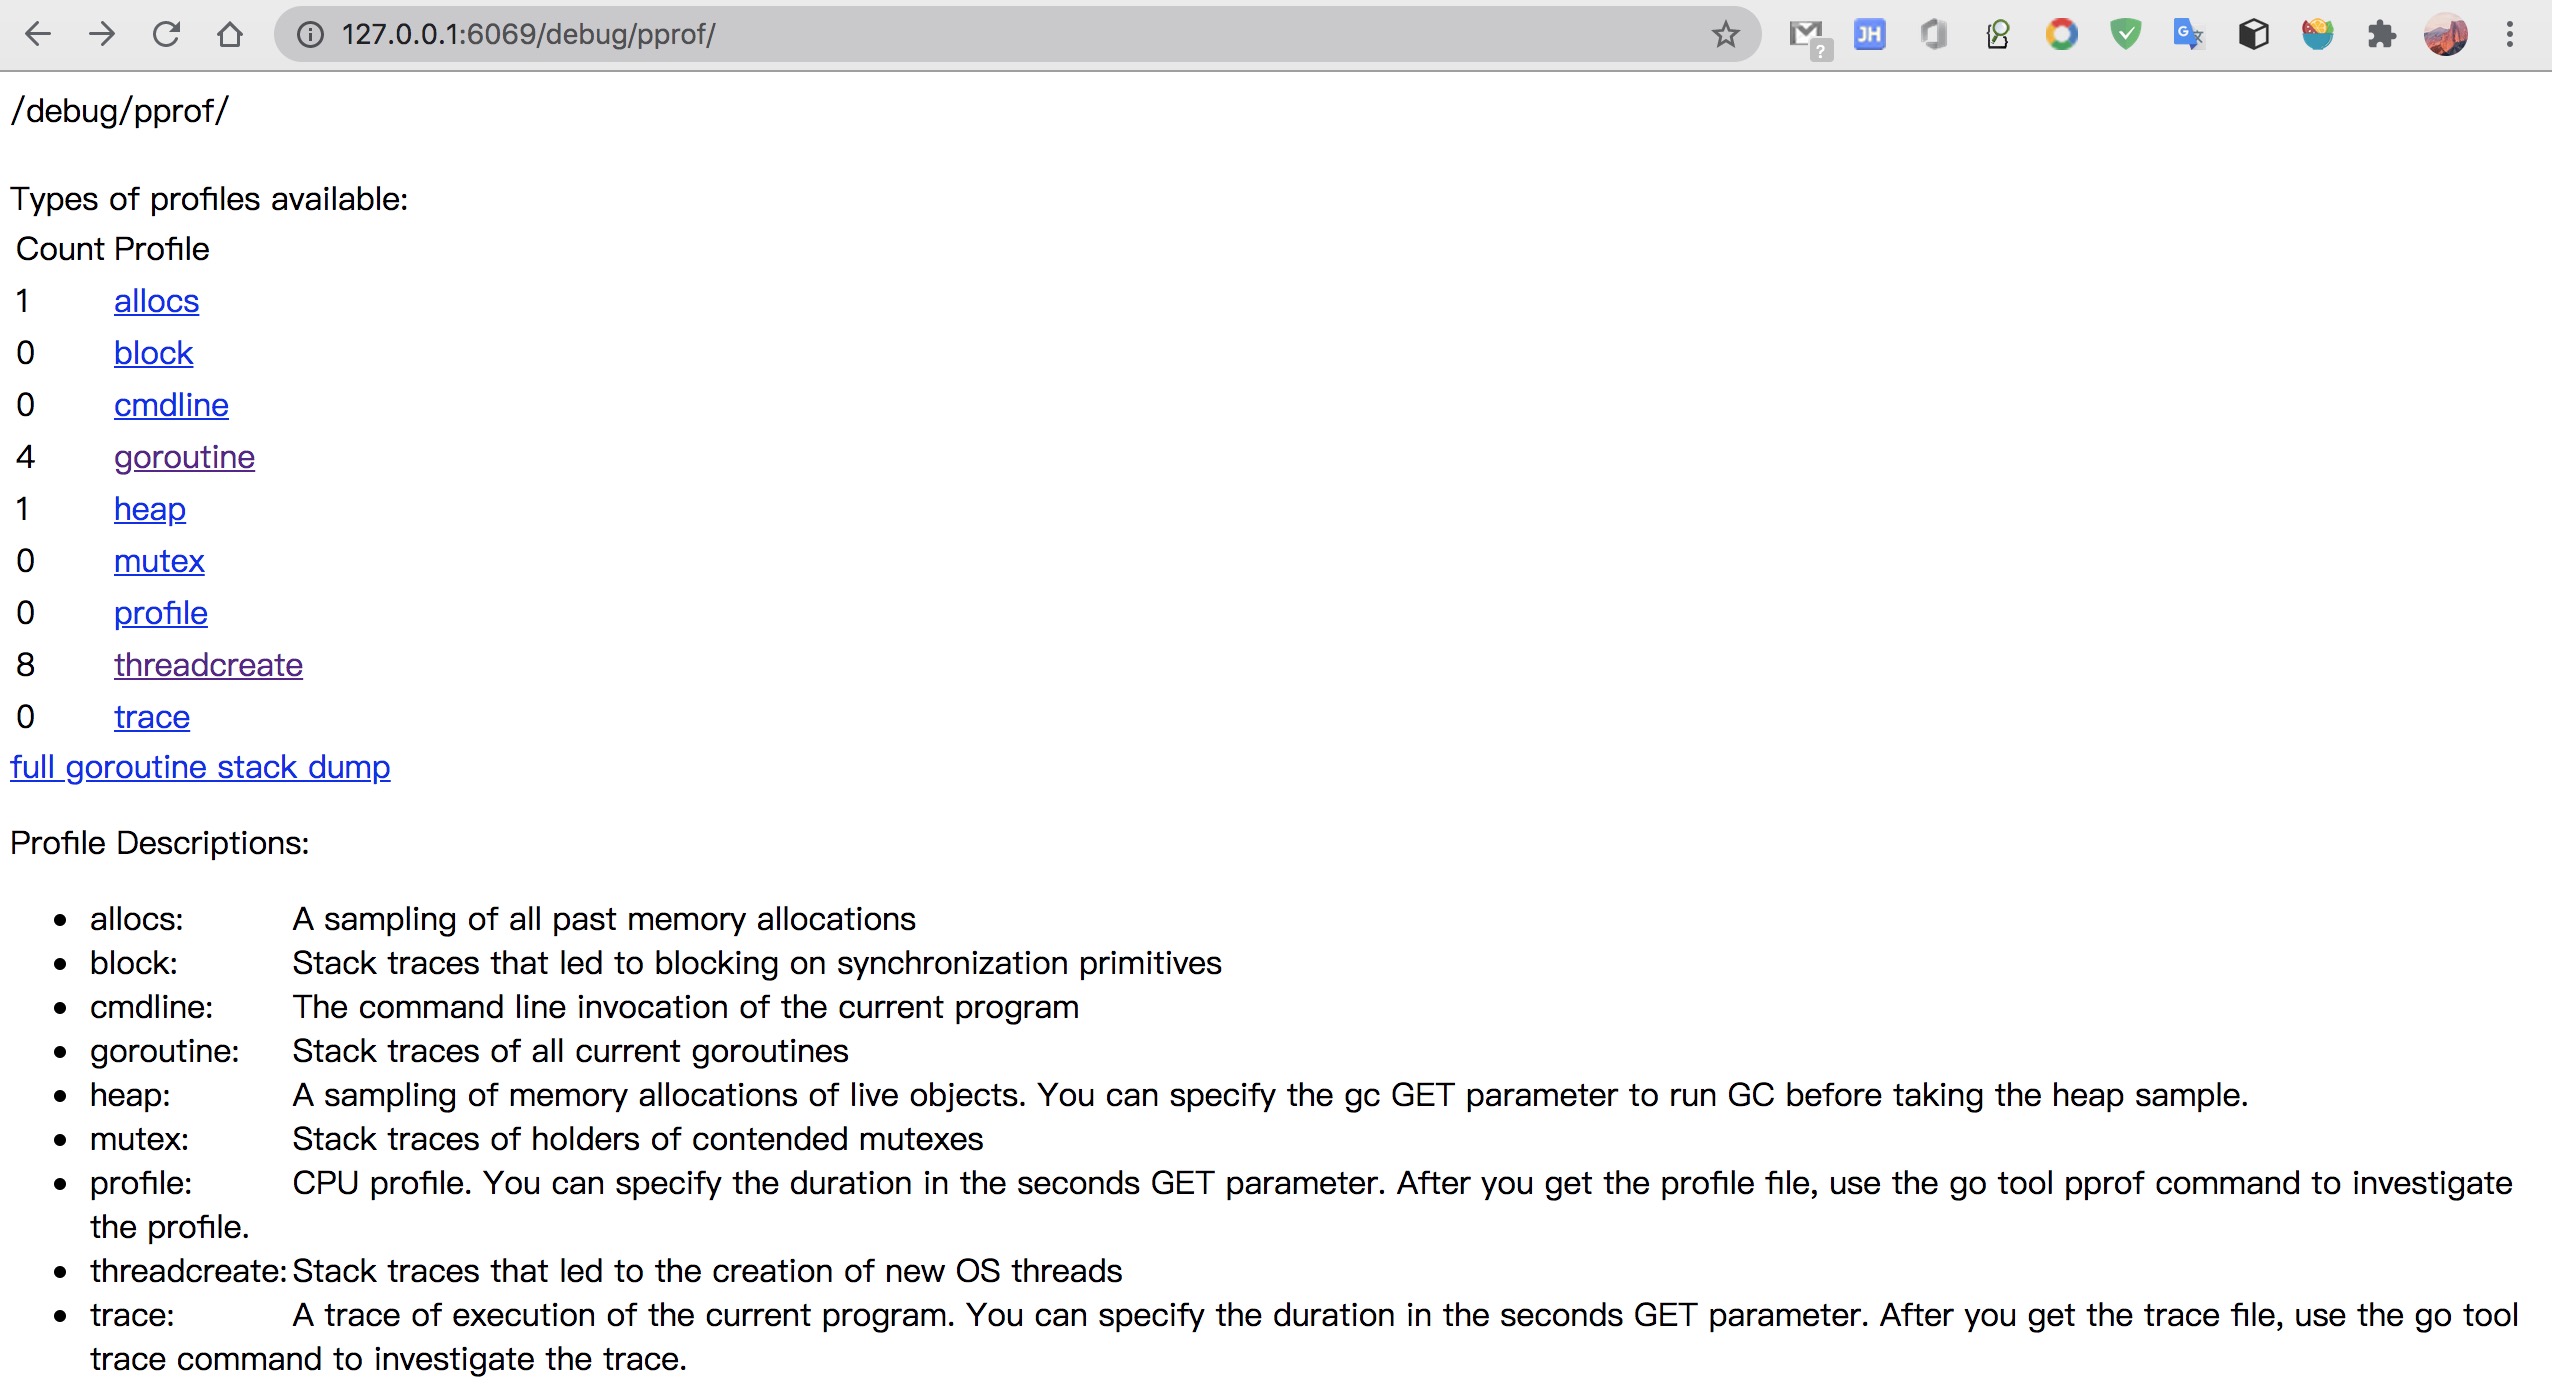
看下具体参数的含义
- allocs: 内存分配情况的抽象情况
- block: 阻塞堆栈的采样信息
- cmdline: 程序启动命令及其参数
- goroutine: 当前协程的堆栈信息
- heap: 堆内存的采样信息
- mutex: 锁竞争的采样信息
- profile: cpu使用情况的采样信息
- threadcreate: 系统程序创建情况的采样信息
- trace: 程序运行的跟踪信息
web 页面我们点到相应的位置,就能看到相应的采样结果,不过web页面的数据展示不太直观
命令行模式分析
使用命令go tool pprof url就可以获取指定的profile文件,下载到本地,使用命令行进行分析
# 下载cpu profile,默认从当前开始收集30s的cpu使用情况,需要等待30s
# 30-second CPU profile
go tool pprof http://localhost:6069/debug/pprof/profile
# wait 120s
go tool pprof http://localhost:6069/debug/pprof/profile?seconds=120

# 下载heap profile
go tool pprof http://localhost:6069/debug/pprof/heap

# 下载goroutine profile
go tool pprof http://localhost:6069/debug/pprof/goroutine

# 下载block profile
go tool pprof http://localhost:6069/debug/pprof/block

# 下载mutex profile
go tool pprof http://localhost:6069/debug/pprof/mutex
定位goroutine泄露
web可视化查看
上面我们分析的可能出现内存泄露的场景,我们拿其中一个做个试验
package main

import (
	"fmt"
	"net/http"
	_ "net/http/pprof"
	"os"
	"os/signal"
	"syscall"
	"time"
)

func main() {
	// 开启pprof,监听请求
	ip := "127.0.0.1:6069"
	// 开启pprof
	go func() {
		if err := http.ListenAndServe(ip, nil); err != nil {
			fmt.Printf("start pprof failed on %s\n", ip)
			os.Exit(1)
		}
	}()

	// 路由,访问,触发内存泄露的代码判断
	http.HandleFunc("/test", handler)

	// 阻塞
	c := make(chan os.Signal, 1)
	signal.Notify(c, syscall.SIGHUP, syscall.SIGQUIT, syscall.SIGTERM, syscall.SIGINT)
	for {
		s := <-c
		switch s {
		case syscall.SIGQUIT, syscall.SIGTERM, syscall.SIGINT:
			time.Sleep(time.Second)
			return
		case syscall.SIGHUP:
		default:
			return
		}
	}
}

func handler(w http.ResponseWriter, r *http.Request) {
	// 接收端受到的channel为nil
	ch := make(chan int, 1)
	go func() {
		<-ch
		fmt.Println(111)
	}()
}
启动,调用三次http://127.0.0.1:6069/test,每次调用将触发一个goroutine阻塞。
通过http://ip:port/debug/pprof/goroutine查看
url请求中设置debug=1
http://127.0.0.1:6069/debug/pprof/goroutine?debug=1
debug=1能看到具体阻塞的goroutine总数量,以及应为某处阻塞的goroutine数量,还有goroutine的调用栈。
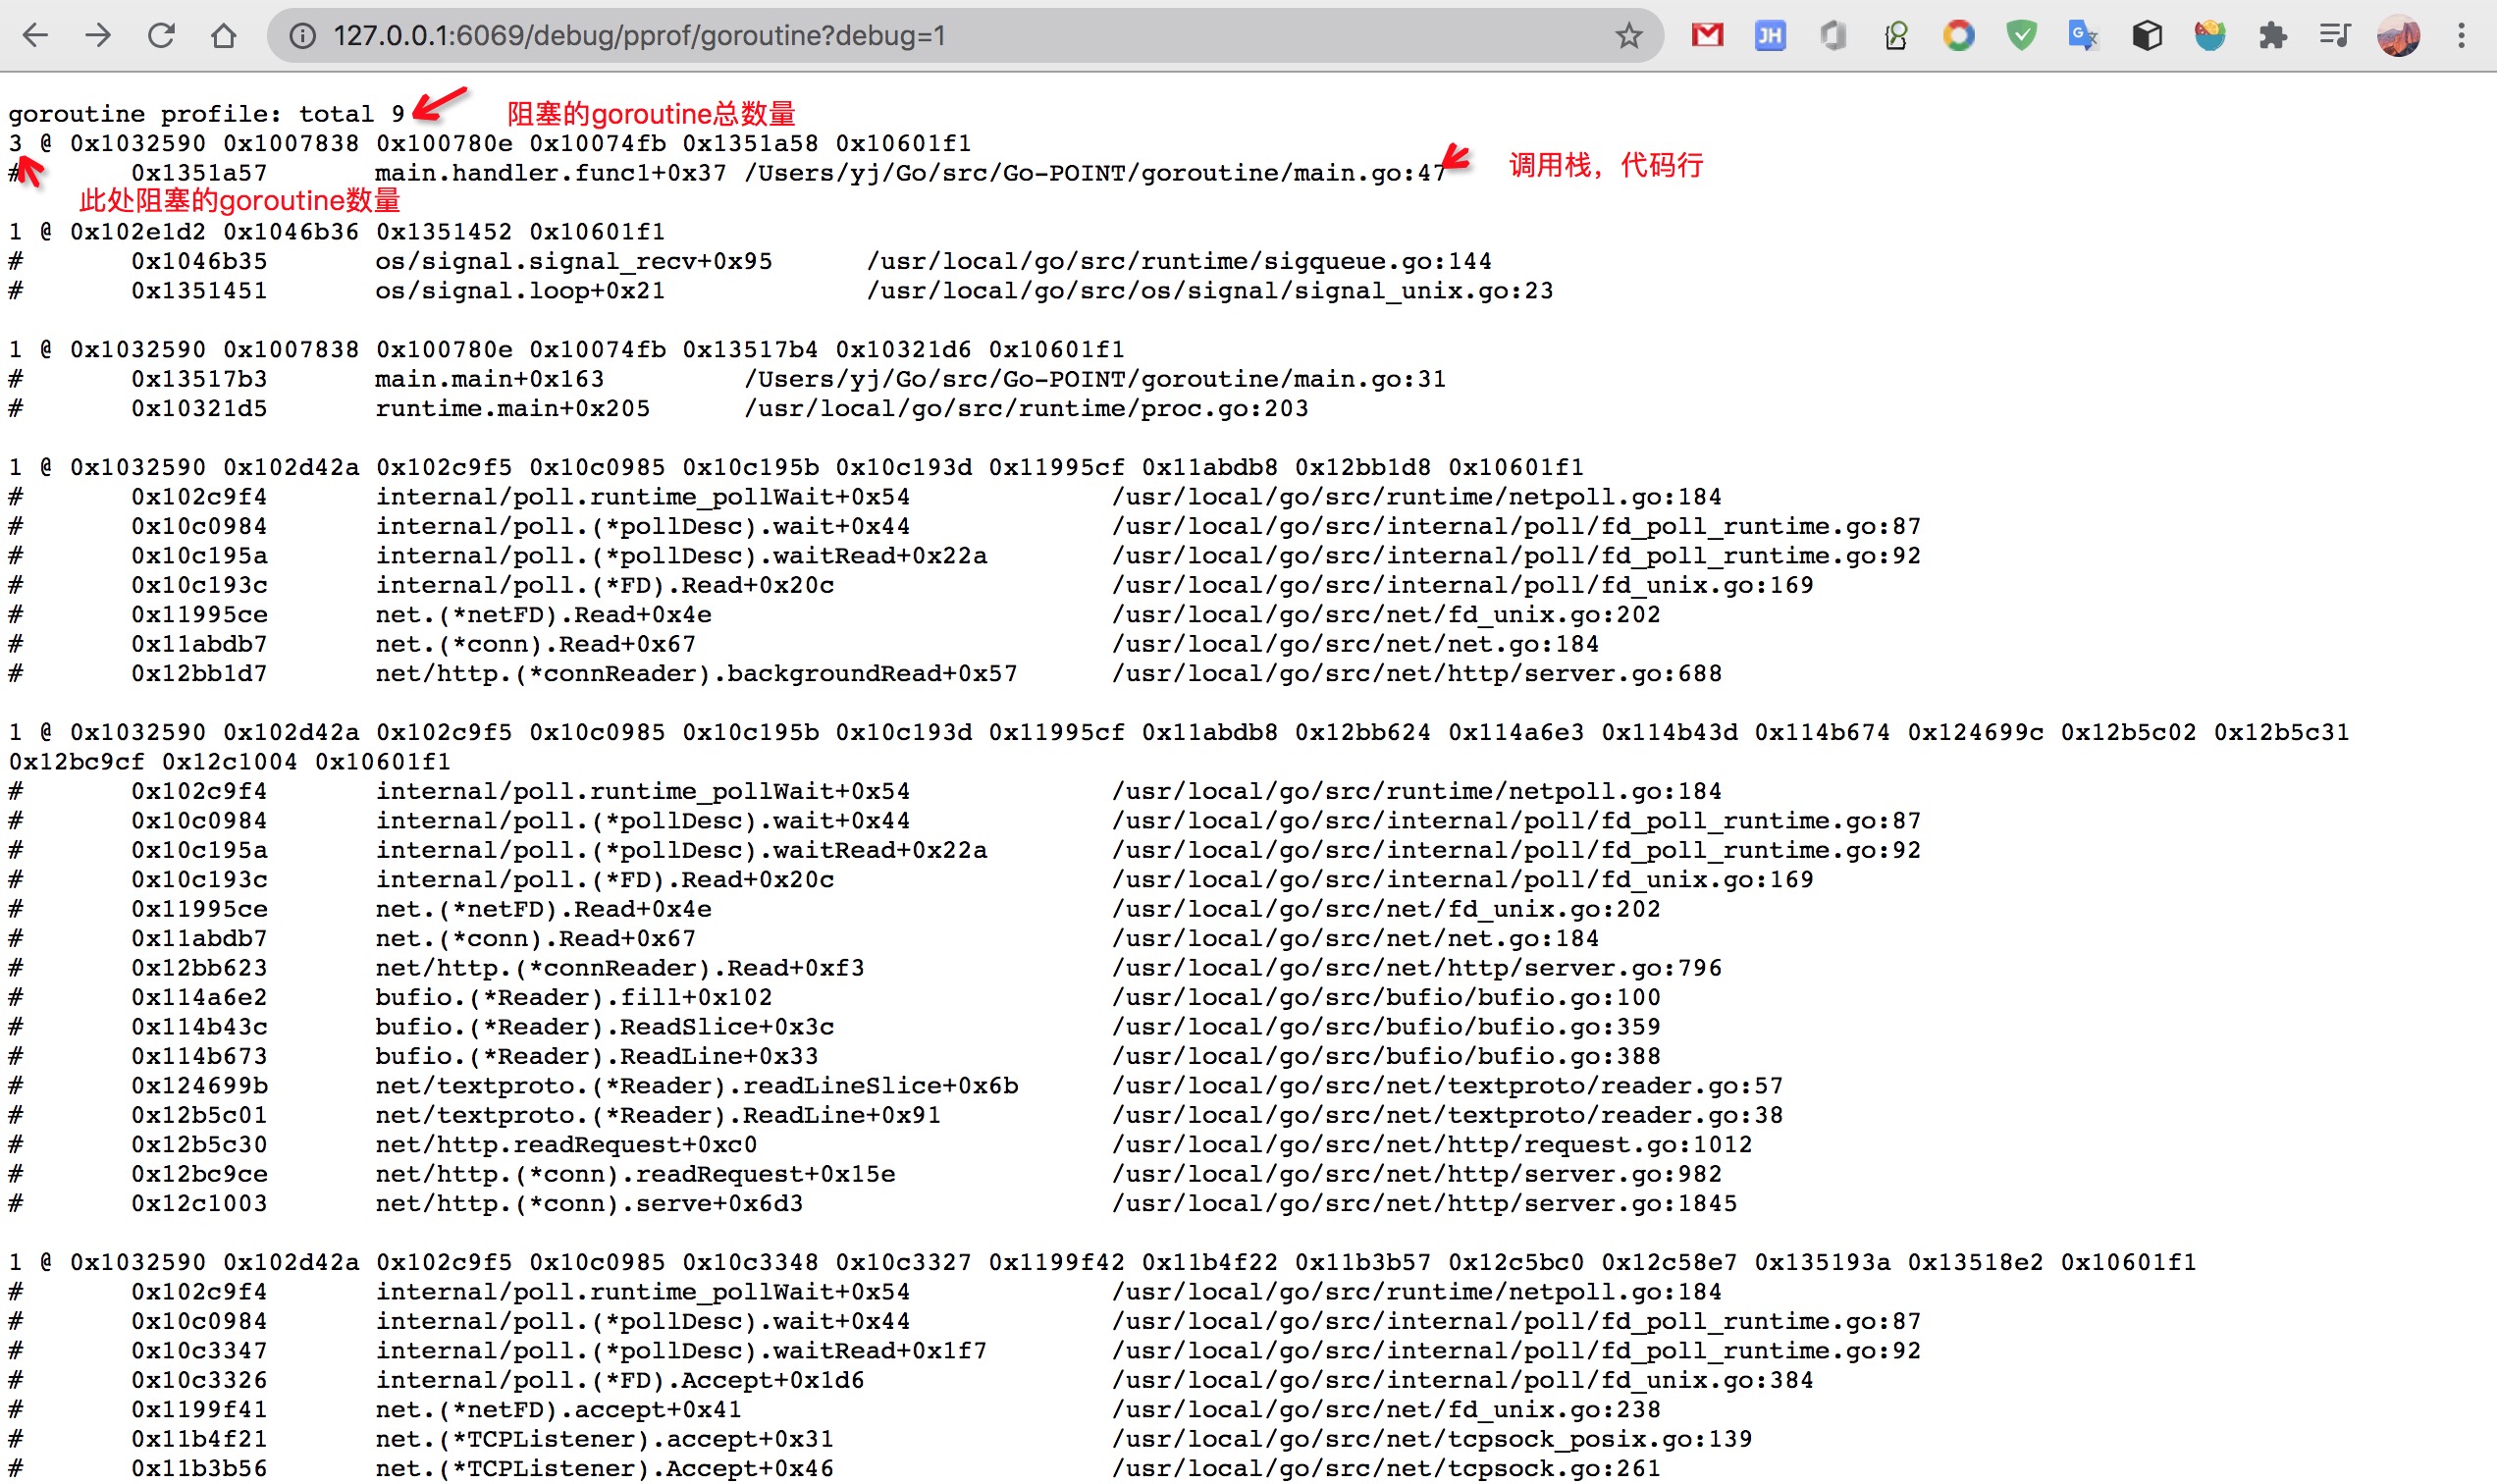
我们在上面调用了三次,所以产生了3个goroutine的阻塞,并且具体的代码行,执行了47。
来看下47行的代码
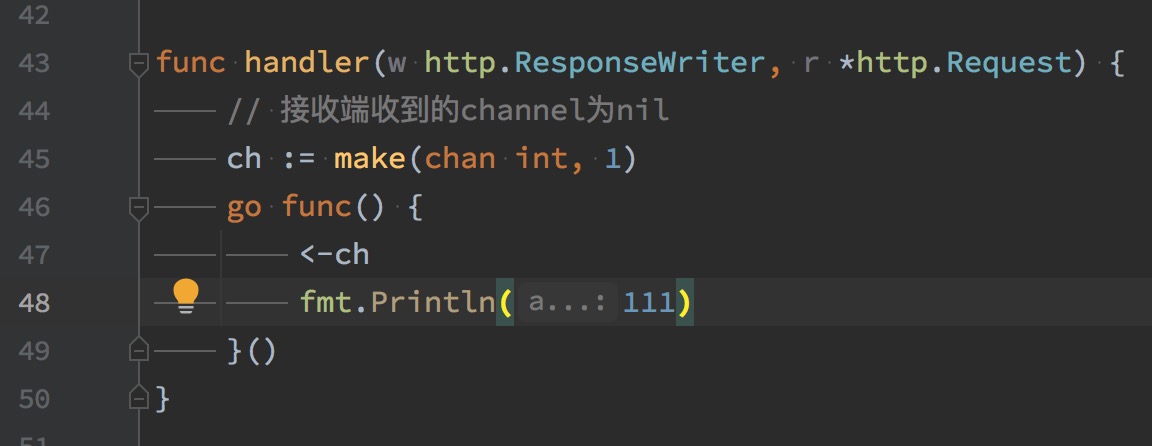
此处阻塞原因,我们在上面也分析了,channel为nil,导致接收的goroutine被阻塞
url请求中设置debug=2
http://127.0.0.1:6069/debug/pprof/goroutine?debug=2
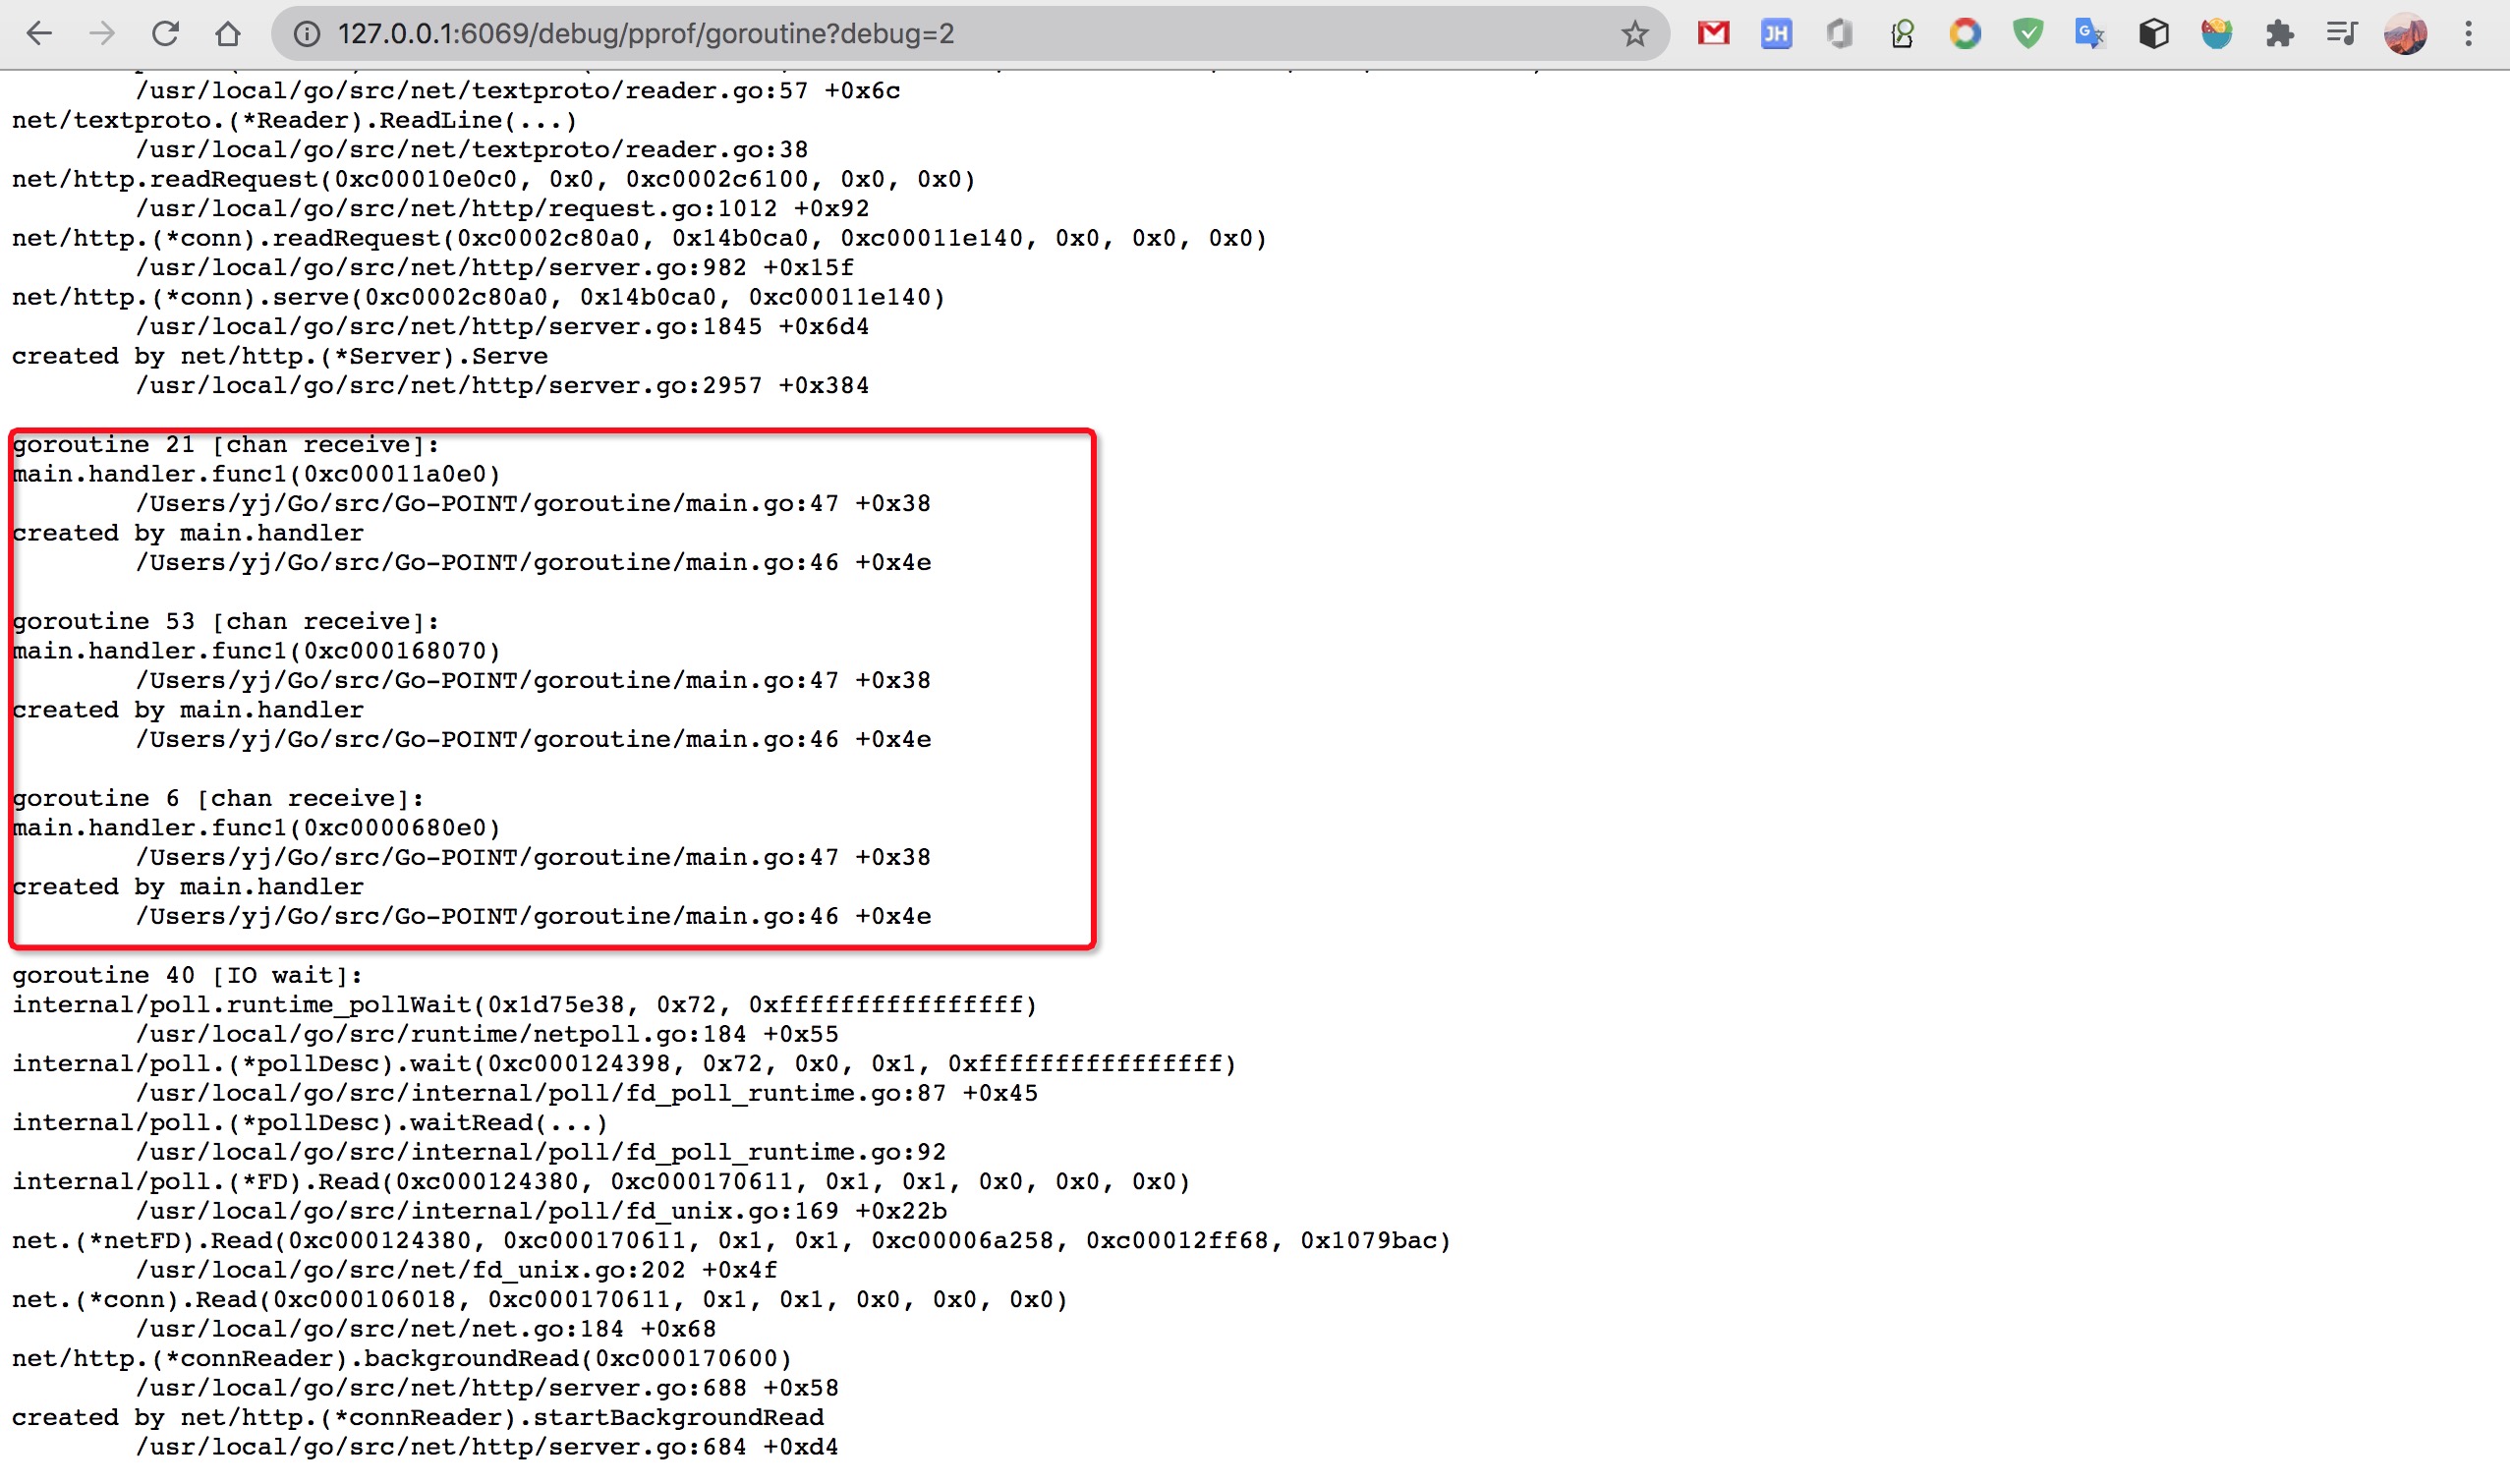
可以看到被阻塞的goroutine的具体信息,并且可以看到阻塞的时间,这个地方是运行完马上看的,所以时间没展示,隔段时间查看就可以看到了
goroutine 21 [chan receive]:
main.handler.func1(0xc00011a0e0)
	/Users/yj/Go/src/Go-POINT/goroutine/main.go:47 +0x38
created by main.handler
	/Users/yj/Go/src/Go-POINT/goroutine/main.go:46 +0x4e
chan receive表示接受者被阻塞了,以及可以看到阻塞的行数,和被阻塞协程的创建行数
当然上面debug=1和debug=2,可以互补的查看,帮助我们排查
使用命令行的方式排查
下载goroutine profile
$ go tool pprof http://0.0.0.0:6069/debug/pprof/goroutine
一般是隔断一段时间下载一次数据采样,然后结合几个个采样数据来分析,间隔时间的数据增加情况。如果几个间隔时间内,goroutine都大量增加,就可以判断发生了goroutine泄露。
使用top, list, traces,这三个命令就可以了,具体的使用我们来来慢慢探究
top
按指标大小列出前10个函数,比如内存是按内存占用多少,CPU是按执行时间多少。
(pprof) top
Showing nodes accounting for 8, 100% of 8 total
Showing top 10 nodes out of 35
      flat  flat%   sum%        cum   cum%
         6 75.00% 75.00%          6 75.00%  runtime.gopark
         1 12.50% 87.50%          1 12.50%  runtime.sigNoteSleep
         1 12.50%   100%          1 12.50%  runtime/pprof.writeRuntimeProfile
         0     0%   100%          1 12.50%  internal/poll.(*FD).Accept
         0     0%   100%          1 12.50%  internal/poll.(*FD).Read
         0     0%   100%          2 25.00%  internal/poll.(*pollDesc).wait
         0     0%   100%          2 25.00%  internal/poll.(*pollDesc).waitRead
         0     0%   100%          2 25.00%  internal/poll.runtime_pollWait
         0     0%   100%          3 37.50%  main.handler.func1
         0     0%   100%          1 12.50%  main.main
(pprof)
top会列出5个统计数据:
对于goroutine分析来讲
flat: 本函数占用的内存量。
flat%: 本函数内存占使用中内存总量的百分比。
sum%: 前面每一行flat百分比的和。
cum: goroutine累计量,比如main函数调用了函数f,函数f占用的内存量,也会记进来。
cum%: 是累计量占总量的百分比。
通过top显示正运行到某个函数goroutine的数量
我们发现main.handler.func1处是3,正式我们上文调用三次出现的结果
list
查看某个函数的代码,以及该函数每行代码的指标信息,如果函数名不明确,会进行模糊匹配,比如list main会列出main.main和runtime.main。
(pprof) list main.handler.func1
Total: 8
ROUTINE ======================== main.handler.func1 in /Users/yj/Go/src/Go-POINT/goroutine/main.go
         0          3 (flat, cum) 37.50% of Total
         .          .     42:
         .          .     43:func handler(w http.ResponseWriter, r *http.Request) {
         .          .     44:	// 接收端收到的channel为nil
         .          .     45:	ch := make(chan int, 1)
         .          .     46:	go func() {
         .          3     47:		<-ch
         .          .     48:		fmt.Println(111)
         .          .     49:	}()
         .          .     50:}
         .          .     51:
         .          .     52://func query() int {
上面可以看到在47行有3个goroutine阻塞到这了
traces
打印所有调用栈,以及调用栈的指标信息
(pprof) traces
Type: goroutine
Time: Jan 3, 2021 at 9:54pm (CST)
-----------+-------------------------------------------------------
         3   runtime.gopark
             runtime.goparkunlock
             runtime.chanrecv
             runtime.chanrecv1
             main.handler.func1
-----------+-------------------------------------------------------
         1   runtime.sigNoteSleep
             os/signal.signal_recv
             os/signal.loop
.....
-----------+-------------------------------------------------------
每个- - - - - 隔开的是一个调用栈,main.handler.func1调用了runtime.chanrecv1造成了3个goroutine的阻塞。
使用top列出正在运行的每个函数的goroutine的数量,list查看某个函数的代码,以及该函数每行代码的指标信息,traces则可以打印函数的调用栈的信息。
web
(需要安装 graphviz,pprof 能够借助 grapgviz 生成程序的调用图)
直接输入web即可调用graphviz生成当前程序的调用图
(pprof) web
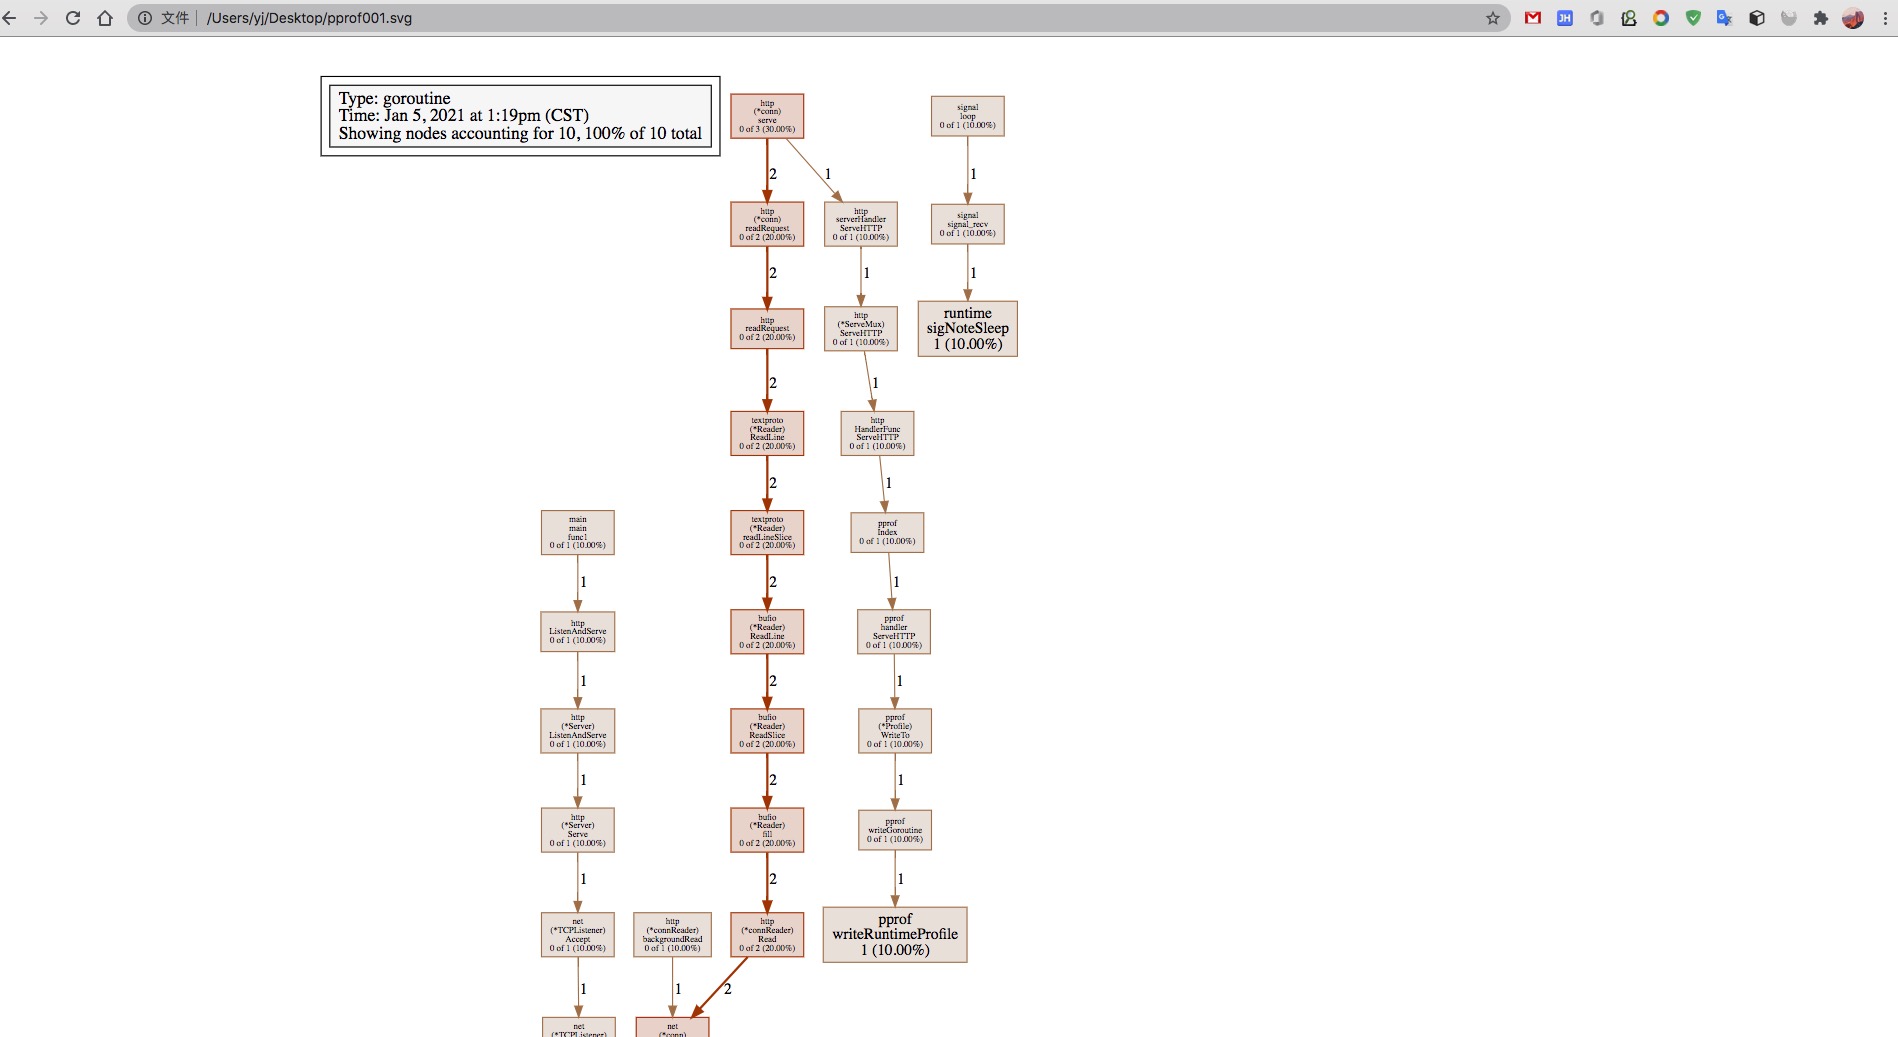
这个图会展示调用信息,同时根据不同的采样信息的类型,展示不同的信息。比如上面采样的是goroutine,那展示的就是goroutine的资源数据。
同时也可以通过浏览器,以服务的形式查看这个图片
$ go tool pprof --http=:8089 /Users/yj/pprof/pprof.goroutine.003.pb.gz
Serving web UI on http://localhost:8089
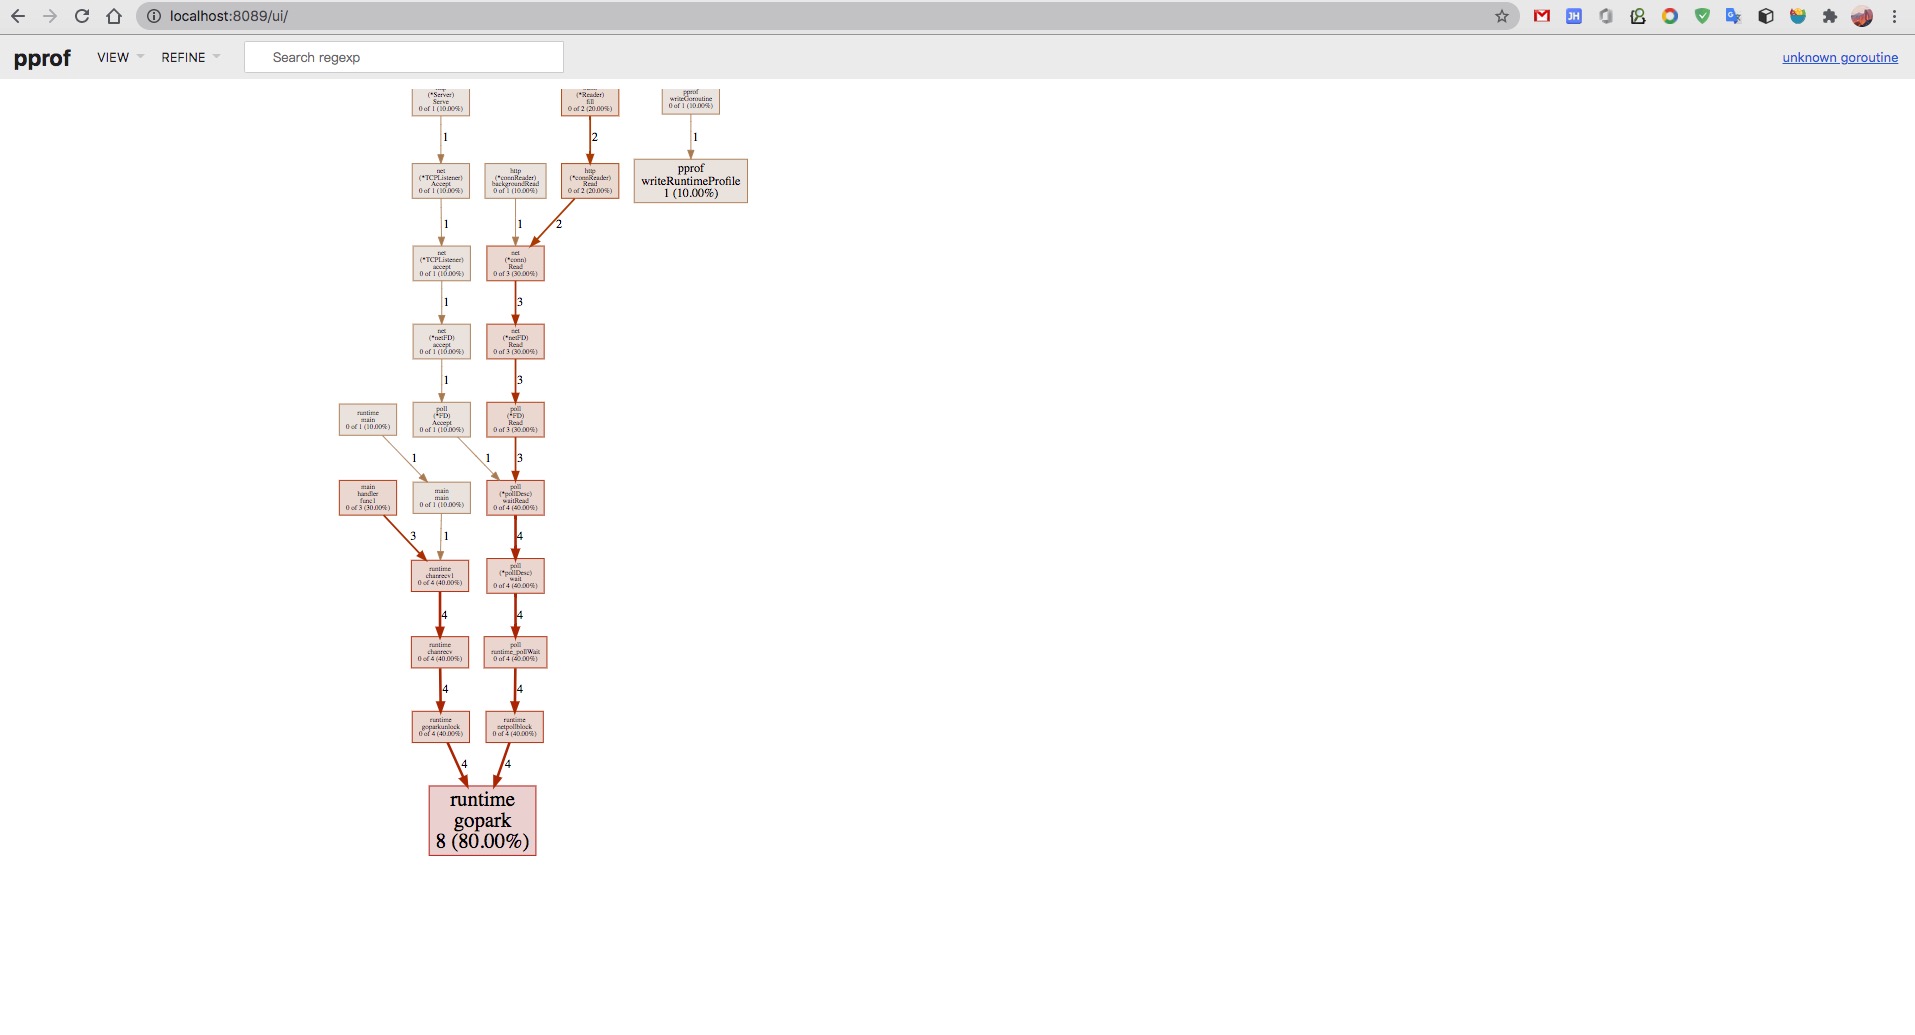
同时可以切花不同的tab查看不同的资源
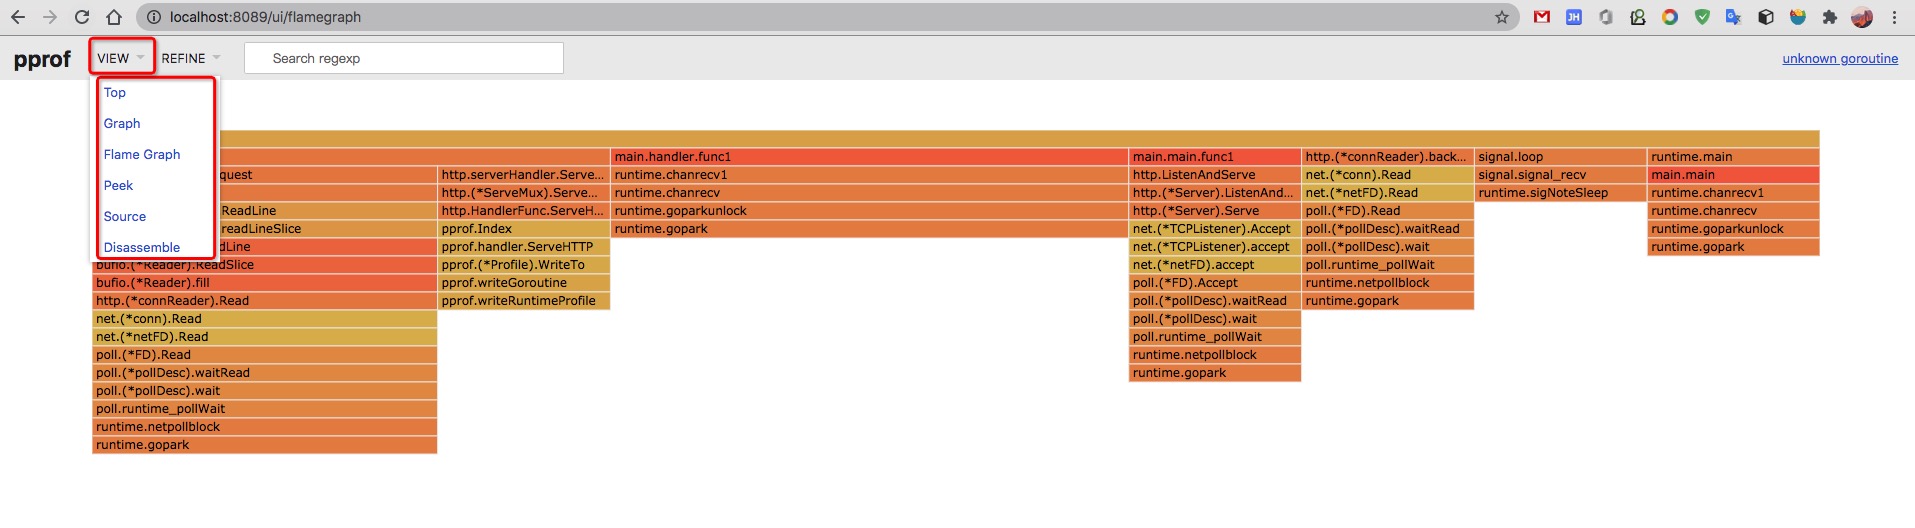
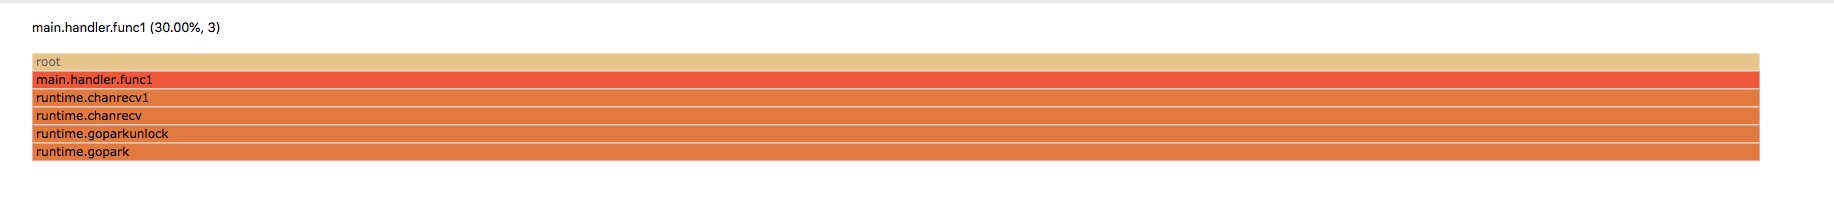
这里面也可以看到一个倒置的火焰图,下图中的正是我们上面阻塞的的三个goroutine的调用信息
如何排查oom
什么是oom?
Out Of Memory,一般是由于程序编写者对内存使用不当,如对该释放的内存资源没有释放,导致其一直不能被再次使用而使计算机内存被耗尽的现象。重启计算机即可,但根本解决办法还是对代码进行优化。
如何排查呢?
基本的排查思路
1、怀疑业务代码(PProf)。
2、怀疑其它代码(PProf)。
3、怀疑 Go Runtime 。
4、怀疑工具。
5、怀疑环境。
总结
string和切片不正确的使用是会引起短暂的内存泄露,当然还有一些句柄的连接未释放都会触发内存泄露。不过最主要的内存泄露还是出现在对channel的错误使用,造成goroutine上面。大量的内存泄露会造成程序的oom,当然包括程序书写不当造成的内存泄露,同时也包括运行环境和语言版本存在的问题,都会造成内存不会被释放。oom原因很多需要根据实际出现的问题进行探究。
参考
【channel关闭的注意事项】https://studygolang.com/articles/16893
【Golang 中的并发限制与超时控制】https://www.jianshu.com/p/42e89de33065
【Golang中WaitGroup、Context、goroutine定时器及超时学习笔记】https://segmentfault.com/a/1190000009602670
【实战Go内存泄露】https://segmentfault.com/a/1190000019222661
【go pprof火焰图性能优化】https://zhuanlan.zhihu.com/p/71529062
【为什么容器内存占用居高不下,频频 OOM】https://eddycjy.com/posts/why-container-memory-exceed/
【一些可能的内存泄漏场景】https://gfw.go101.org/article/memory-leaking.html